THE JOSKE REPORT · MAY 2026

Inventory is at a trough. Spring prices set a new high.

San Francisco residential real estate, district by district. Single Family + Condo / Townhouse. Presented Jun 1, 2026.

-41%Active inventory YoY (691 vs 1,163)
134%Sale vs List, hottest SFH band ($1.5–2M)
$2.20MSFH median, May 2026 (new high)
$1.33MCondo / TH median, May 2026

Volume is roughly normal (484 closes vs the 488 ten-year May average) but listings are at a trough. The result: prices at decade highs, 83% of Single Family homes sold above list, and cash competition climbing. At $5M+, 64% of Single Family sales close in cash, and Condos run cash-heavier than Single Family at every band above $1M.

Residential Real Estate Market Activity

COMING SOON
327
Units pre-market
as of Jun 1, 2026
ACTIVE
691
Snapshot May ’26
MoM -7% · YoY -41% (vs 1,163)
PENDING
360
Units in escrow
live snapshot
SOLD
484
Closed in May
MoM +7% · YoY +10% (vs 439)

Citywide sales +10% YoY (484 closes vs 439 in May 2025), and +7% vs April. Volume is normal. The inventory gap (691 vs 1,163 active) is what is keeping competition tight.

KEY INSIGHTS · BY PROPERTY TYPE
SINGLE FAMILY
247 closes · median $2.20M (+22.6% YoY) · Sale vs List median 123.9% (+14.0pp YoY) · 83% sold over ask
CONDO + TOWNHOUSE
237 closes · median $1.33M (+3.1% YoY) · Sale vs List median 101.3% (+1.3pp YoY) · 59% sold over ask

SFH heat concentrates at $1.5–3M (127-134% of list); Condos peak at the upper tiers.

Each cell shows median Sale vs List (big number), number of closes, share that sold above list, and median price per square foot. Shade tracks heat intensity. Original list-price band, not final.

LIST PRICE → Under $1M $1–$1.5M $1.5–$2M $2–$3M $3–$5M $5M+
SINGLE FAMILY
247 closes
100%
21 sold · 43% over
$771 / sqft
122%
29 sold · 90% over
$958 / sqft
134%
53 sold · 89% over
$1,137 / sqft
127%
69 sold · 90% over
$1,185 / sqft
122%
53 sold · 89% over
$1,422 / sqft
106%
22 sold · 64% over
$1,997 / sqft
CONDO + TOWNHOUSE
237 closes
100%
73 sold · 33% over
$903 / sqft
102%
56 sold · 68% over
$1,120 / sqft
103%
58 sold · 67% over
$1,273 / sqft
113%
35 sold · 71% over
$1,424 / sqft
121%
13 sold · 92% over
$1,778 / sqft
137%*
2 sold · 50% over
$2,062 / sqft
Takeaway: Single Family heat concentrates in $1.5M to $3M (127-134% of list, ~90% over ask). Condo / Townhouse heat lives in the upper tiers. $2M and up clear 113% with 71-92% over ask.

* Condo $5M+ band had only 2 sold listings, directional only. Original list-price (SF asks are often strategic underprices, so the band reflects what sellers signaled, not what buyers paid). Source: SF MLS via InfoSparks. Tenancy in Common excluded. Sales above 200% Sale-vs-List excluded as data-entry outliers.

The trend, and where cash competes hardest.

Price trend smoothed to remove seasonal noise. Cash share broken down by property type, year-to-date.

How to read these charts:
  • Left chart, price trend: Bold line is the 12-month rolling median sale price (smooths out seasonality). Faded line behind it is the raw monthly median (shows the seasonal pattern (SFH peaks each spring, dips each winter)). The endpoint dollar values are the most recent month.
  • Right chart, cash share: Two bars per price band: blue for Single Family, teal for Condo / Townhouse. Each bar is the percentage of closed sales in that band that were all-cash, 2026 year-to-date. Asterisk = fewer than 10 sales (directional only).
  • Sample period: 2016 through May 2026. The 2026 chart points are year-to-date (Jan–May).
  • Universe: Single Family + Condo / Townhouse only. Tenancy in Common excluded. Sale-vs-List above 200% excluded as outliers. Cash percentages use reported-financing closes only.

Charts come from the AI-backed workflow Paulo built. It reads the latest MLS data, applies the cuts and filters Joske uses, and draws the same view every cycle.

Median sale price 2016 to May 2026 with 12-month rolling average. Single Family trailing line $1.29M to $1.83M, May 2026 raw monthly hit $2.20M. Condo/TH near flat around $1.20M.
Median Sale Price · 2016–May 2026. Single Family trailing-12-month line climbed $1.29M → $1.83M; May ’26 raw monthly hit $2.20M, a new high. Condos near flat (~$1.20M). The SFH-vs-Condo gap keeps widening.
All-cash share by price band 2026 year-to-date split by Single Family and Condo Townhouse. Both types climb dramatically at $3M+. At $5M+, Single Family 64% cash vs Condo 83% cash.
All-Cash Share by Price Band · 2026 YTD. Condos run cash-heavier than Single Family at every band above $1M, 83% vs 64% at $5M+. Both types jump at $3M as jumbo financing thins.

District by district, May 2026

Each card shows the current sold count, the Single Family vs Condo / Townhouse split with YoY change, the district’s overall Sale-vs-List, and the top sale.

2206 Lake St, top sale in District 1
DISTRICT 1
32sold (+10% YoY)
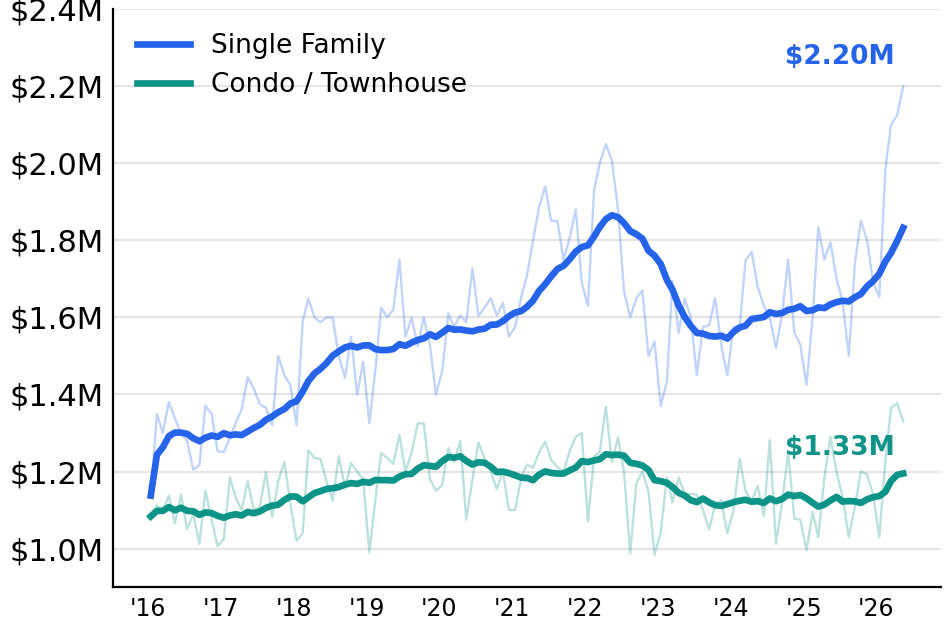
$3.30MSFH median +56% · n=23
$1.33MCondo median -24% · n=9
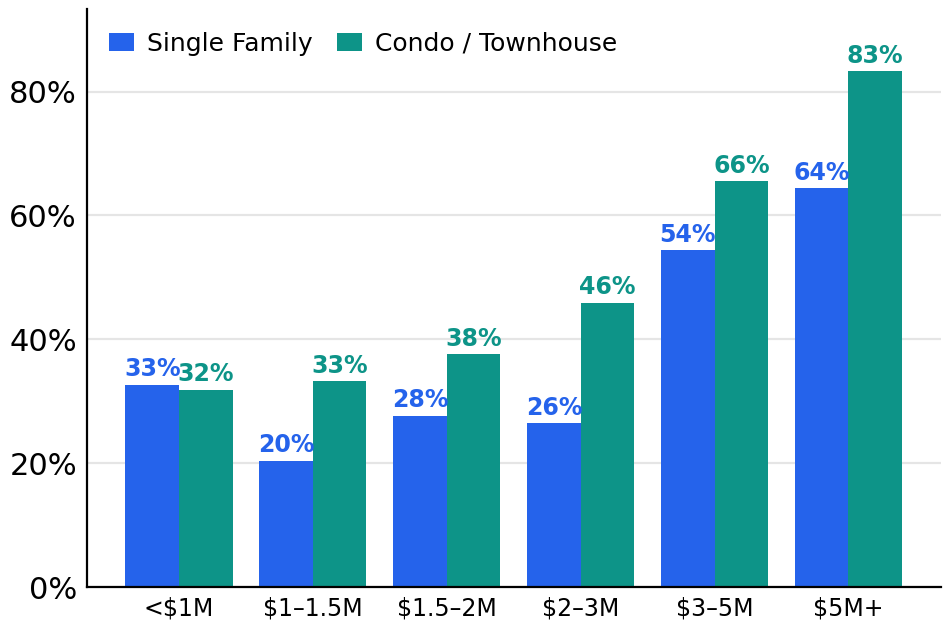
123.9%SFH Sale/List +15.0pp
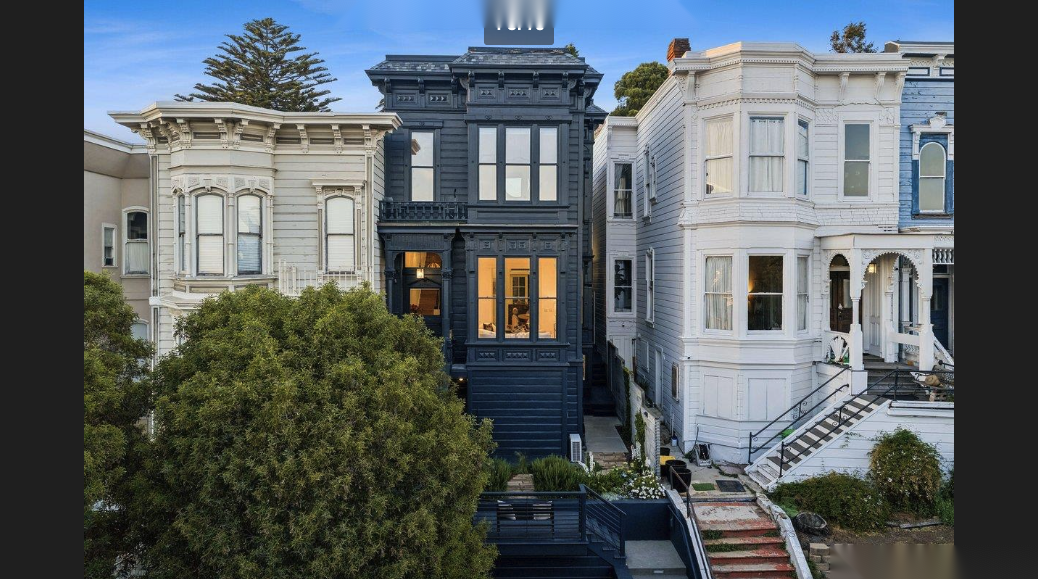
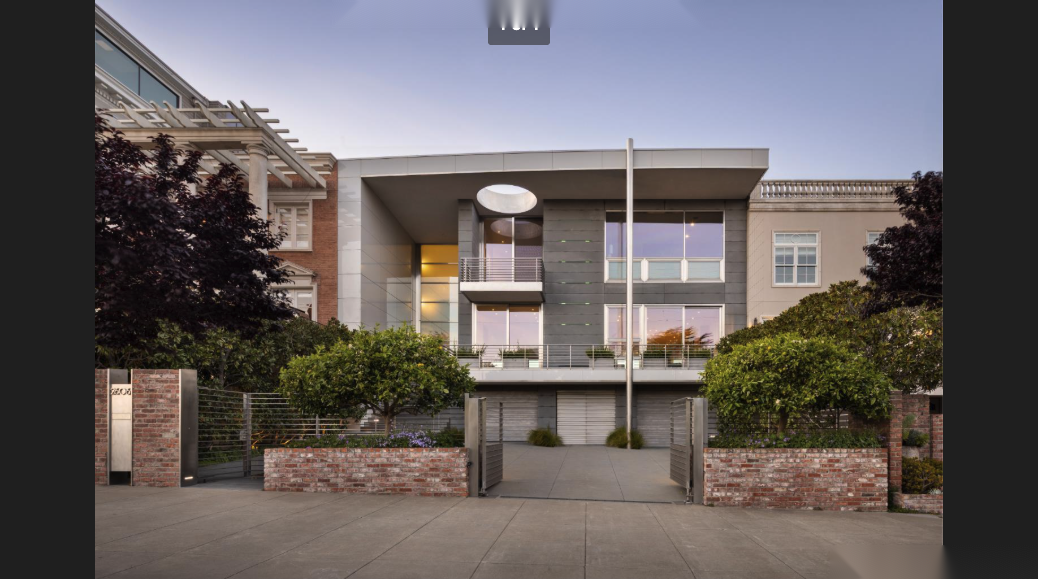
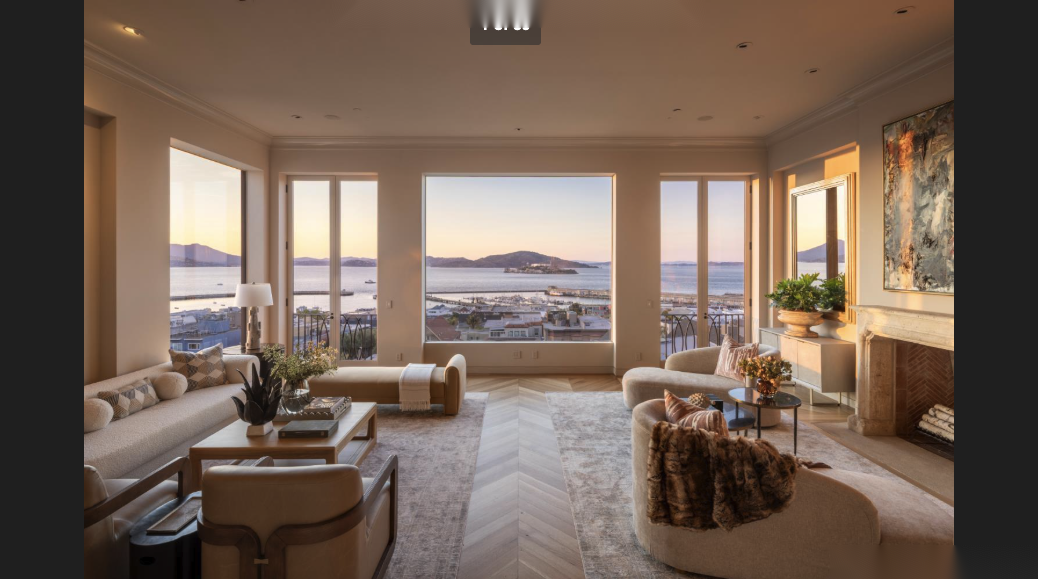
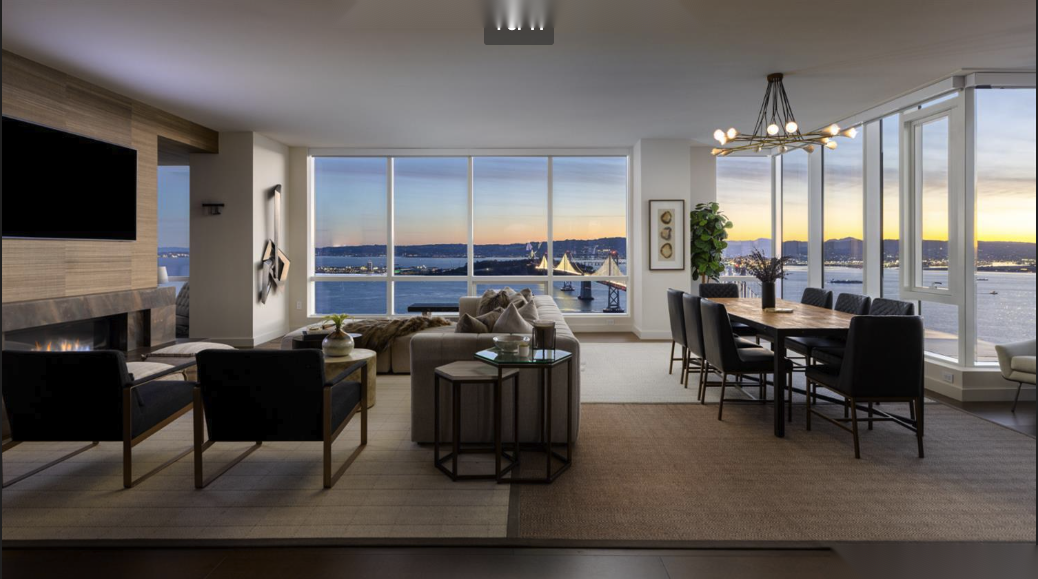
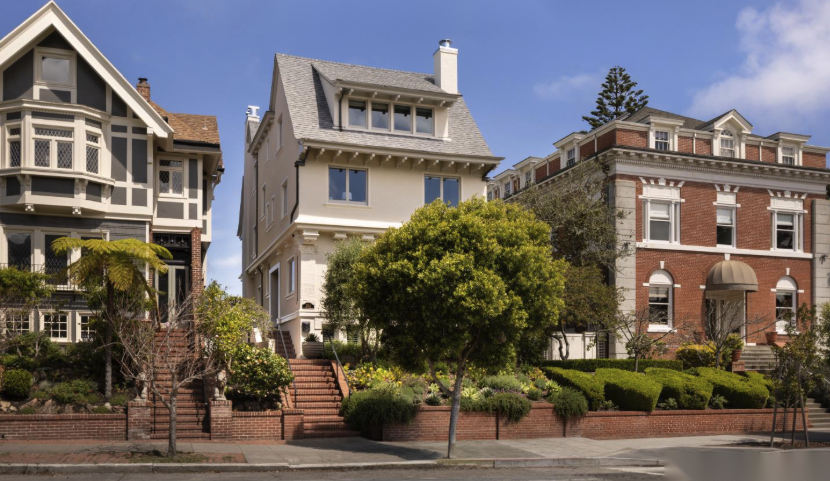
Top sale: 2206 Lake St (Lake Street)
LIST$8.70M
SOLD$11.00M
VS ASK+26.4%
$/SQFT$2,165
FINANCINGCash
1759 8th Ave, top sale in District 2
DISTRICT 2
51sold (+21% YoY)
$2.10MSFH median +31% · n=45
$1.46MCondo median +3% · n=6
135.7%SFH Sale/List +15.6pp
Top sale: 1759 8th Ave (Inner Sunset)
LIST$2.50M
SOLD$4.00M
VS ASK+60.3%
$/SQFT
FINANCINGCash
141 Stonecrest Dr, top sale in District 3
DISTRICT 3
14sold (+27% YoY)
$1.24MSFH median -9% · n=14
Condo: no sales this month
108.5%SFH Sale/List -4.9pp
Top sale: 141 Stonecrest Dr (Lakeside)
LIST$2.50M
SOLD$3.18M
VS ASK+27.5%
$/SQFT$1,112
FINANCINGConventional
111 Edgehill Way, top sale in District 4
DISTRICT 4
36sold (-12% YoY)
$2.40MSFH median +14% · n=35
$1.86M*Condo median · n=1 *thin
123.5%SFH Sale/List +8.1pp
Top sale: 111 Edgehill Way (Forest Hill Extension)
LIST$7.95M
SOLD$7.80M
VS ASK-1.9%
$/SQFT$771
FINANCINGPrivate
4963 17th St, top sale in District 5
DISTRICT 5
72sold (-5% YoY)
$2.85MSFH median +14% · n=39
$1.63MCondo median +3% · n=33
124.0%SFH Sale/List +15.4pp
Top sale: 4963 17th St (Cole Valley / Parnassus)
LIST$6.50M
SOLD$8.10M
VS ASK+24.6%
$/SQFT$2,244
FINANCINGCash
2148 Pine St, top sale in District 6
DISTRICT 6
33sold (+32% YoY)
$4.00MSFH median +19% · n=8
$1.31MCondo median +3% · n=25
127.0%SFH Sale/List +15.8pp
Top sale: 2148 Pine St (Lower Pacific Heights)
LIST$4.70M
SOLD$4.79M
VS ASK+2.1%
$/SQFT$1,355
FINANCINGConventional
2606 Jackson St, top sale in District 7
DISTRICT 7
46sold (+2% YoY)
$7.65MSFH median +0% · n=10
$2.19MCondo median +41% · n=36
116.8%SFH Sale/List +16.8pp
Top sale: 2606 Jackson St (Pacific Heights)
LIST$22.50M
SOLD$24.00M
VS ASK+6.7%
$/SQFT$3,213
FINANCINGCash
888 Francisco St, top sale in District 8
DISTRICT 8
54sold (+46% YoY)
$5.15MSFH median +268% · n=10
$1.25MCondo median +4% · n=44
100.1%SFH Sale/List -12.0pp
Top sale: 888 Francisco St (Russian Hill)
LIST$17.25M
SOLD$17.25M
VS ASK+0.0%
$/SQFT$2,750
FINANCINGCash
488 Folsom St #5301, top sale in District 9
DISTRICT 9
99sold (+4% YoY)
$2.00MSFH median +22% · n=24
$1.10MCondo median +0% · n=75
128.5%SFH Sale/List +19.0pp
Top sale: 488 Folsom St #5301 (South Beach)
LIST$9.99M
SOLD$9.85M
VS ASK-1.5%
$/SQFT$2,358
FINANCINGConventional
32 Edinburgh St, top sale in District 10
DISTRICT 10
47sold (+24% YoY)
$1.20MSFH median +14% · n=39
$0.75MCondo median +55% · n=8
125.2%SFH Sale/List +19.6pp
Top sale: 32 Edinburgh St (Excelsior)
LIST$1.59M
SOLD$2.35M
VS ASK+47.5%
$/SQFT$1,005
FINANCINGConventional

YoY = May 2026 vs May 2025. * = thin sample (fewer than 5 closes); treat the number as directional only. Single Family district medians can swing on small n, especially in lower-volume districts. Source: SF MLS via InfoSparks. TIC and outliers above 200% Sale-vs-List excluded.

Want a deeper read on YOUR block?

This report is the citywide picture. Your block, your floor, your timing. Those tell a different story. A 15-minute conversation usually surfaces what a static report cannot.

Joske Thompson
Real Estate Broker · Compass · DRE# 00843865

Two roles, kept honest.

METHODOLOGY & JUDGMENT

Joske Thompson

Joske decides what gets tracked and how it gets read. The price bands, the comparisons, the filters, the outlier rules, what counts as a trend versus noise: those are his calls, drawn from twenty years of San Francisco transactions.

He looks at every cycle before it ships. If a number does not pass his read, it does not go out.

Real Estate Broker, Compass · DRE# 00843865

AI-BACKED WORKFLOW

Paulo Serna

Paulo built the AI-backed workflow that turns Joske’s rules into the same report every two weeks. The workflow pulls the latest MLS data, applies the filters Joske uses, and builds the charts, the deck, and this website. It handles the spreadsheet work so Joske can focus on the read.

The point is not the AI. The point is that Joske’s rules are written down once and run the same way every cycle, which keeps Joske in his zone.

Real Estate Agent, Level Up Group, Compass · DRE# 02150409

Sources: SF MLS via InfoSparks for Active, Pending, and Sold counts. Compass for off-market and private exclusives. Tenancy in Common excluded. Sale-vs-List above 200% excluded as data-entry outliers. Cash percentages use closes with reported financing only. Cadence: bi-weekly, with monthly and quarterly editions when the cycle calls for a deeper read.